
API monitoring

Know exactly what’s going on with your API

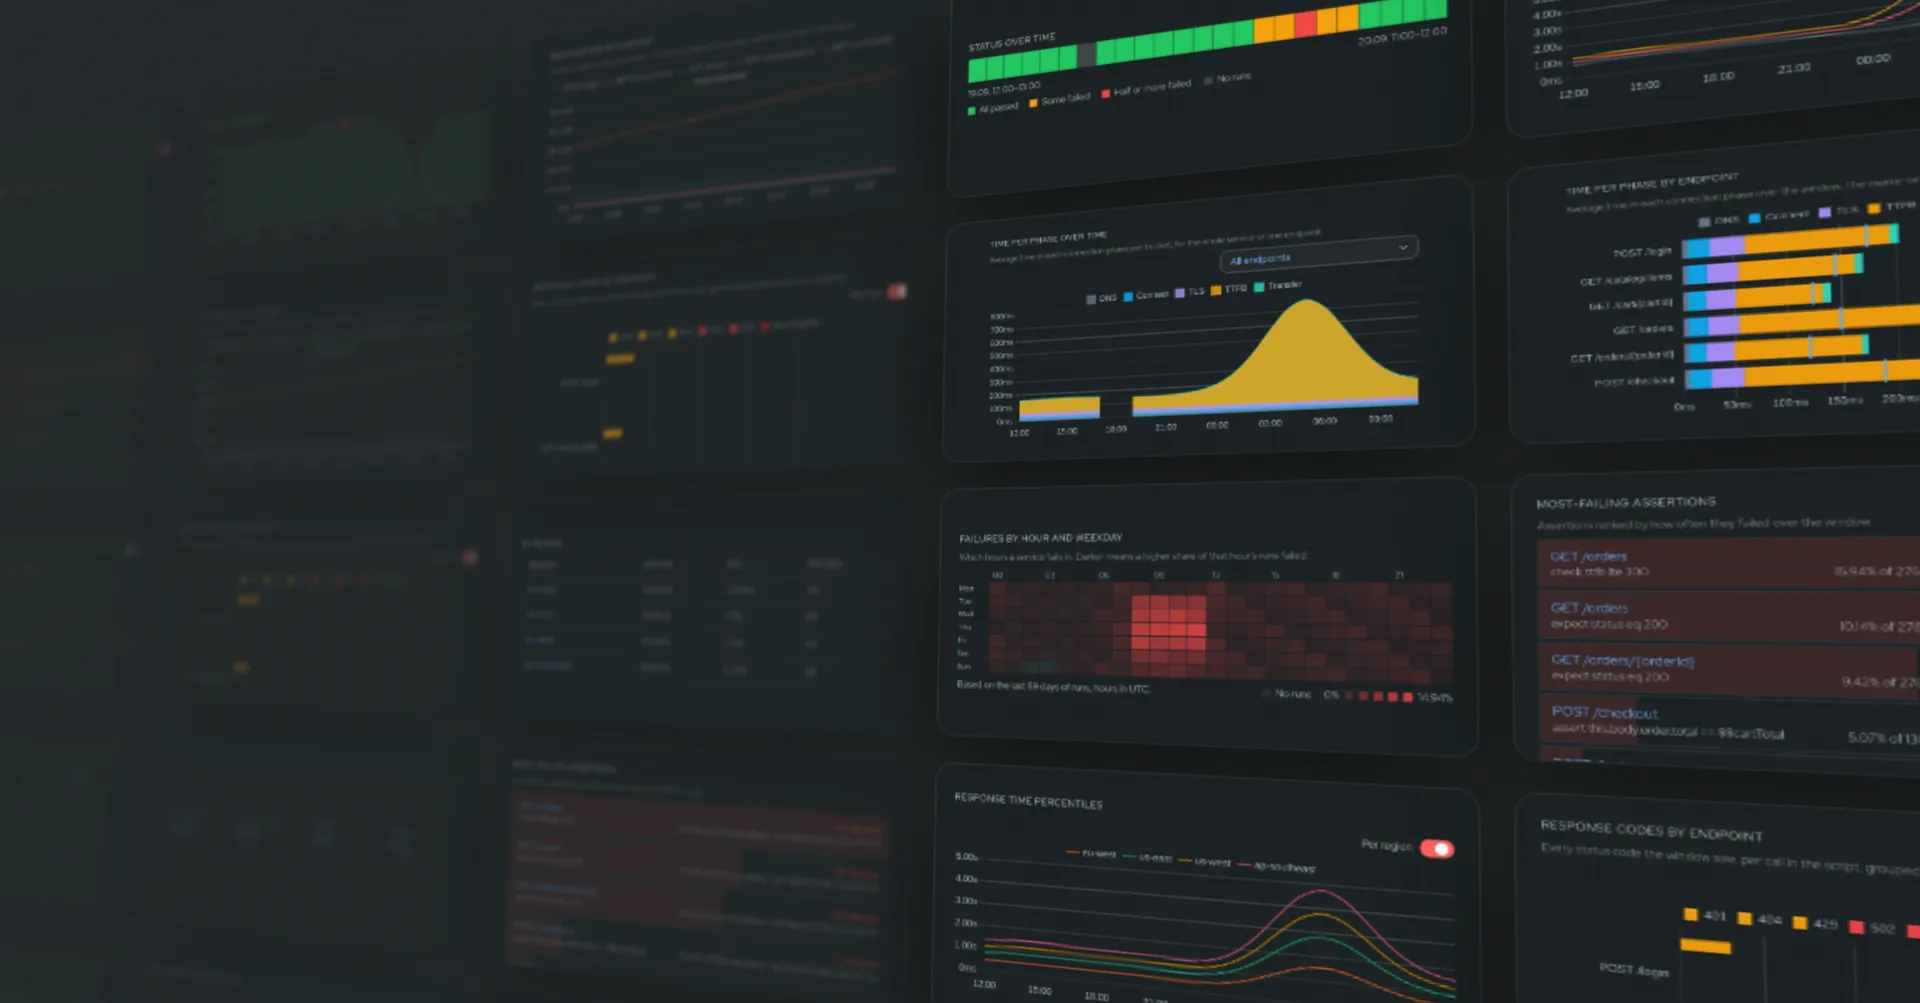
Monitoring in depth, answers at a glance. Exact per-phase call timings, status and uptime checks, baseline tracking, response schema validation, a record of what every check actually saw, and much more. See the Tracedown wiki for the full list of capabilities.

  • Assertions keep what they saw. Scope, operator, expected, actual — stored per call. Assert on status, body, JSON schema, headers, size, redirect hops and each timing phase, and catch the error your API returned inside a 200.
  • Alerts are part of the check. A notification is declared on the assertion itself, so what alerts and what it says travel with the probe. Email and webhook channels, coalesced per run, with cooldowns, silences, quiet hours and maintenance windows.
Free access for the duration of the open preview

What can it do?

Use cases

Uptime monitoring

Define exactly what counts as uptime

Status code monitoring

Explicit notifications for different status codes

Response time monitoring

Know if an endpoint responds too slowly for your needs

Spike monitoring

Detect when the service comes under heavy load

Functionality monitoring

Make sure the API calls actually do what they should

Custom tracking

Save the variables you might need later

Regional probing

Know if your service responds quickly from every region

Body structure assertions

Never miss a changed response shape

What you are looking at

One service, as the app shows it

The probe is a sequence of requests with assertions on each. Every run keeps its timings and every assertion’s result, and the tabs are the app’s own.

checkout-journey

*/5 * * * *
Active
Probe mode

consecutive

Queue policy

skip

Save response bodies

Not saved

Maintenance window

None

Total probes

8,640

Success rate

99.9%

Avg response / call

174ms

Last status

success

Response time

p50

350ms

p95

665ms

p99

840ms

Recent probes

avg 174ms21:3522:0022:2522:5023:1523:400ms50ms100ms150ms200ms250ms01Avg responseFailed calls
// Log in
post("https://api.example.com/login", {
body: json({ email: "$o.user", password: "$o.pass" })
})
.expect(status: 200)
// Store the token for later
.store({ "$$token": this.body.access_token })

// Get all orders
get("https://api.example.com/orders", {
headers: { Authorization: "Bearer $$token" }
})
// Fires only when the check fails
.expect(status: {
value: 200,
options: {
notification: op_map({
"401": text("Orders rejected the session token"),
"503": text("Orders API is unavailable"),
"default": template("default_notif_auth")
})
}
})
// Optional condition, warns but does not fail the run
.check(ttfb: { value: 300 })

Probes are written in Lace,

An open-source purpose-built DSL for HTTP probing.

lacelang.devLanguage repo

5timing phases per call
12assertion scopes
cronschedule per service
Apache 2.0core, self-hostable

Start with Tracedown

PricingSelf-host